
Are You Hooked on HOPE-pium?
It is not uncommon for Executives to rely on gut and hope. Hope is extremely powerful and often dismisses data. We refer to this situation as being hooked on “HOPE-pium.” High Achievement Companies are disciplined about data and use data to drive decisions; Using data to drive decisions cuts through ego, emotion, hope and excuses.
High Achievement Companies use just a few bits of data to assess performance and drive results. The three types of data used by High Achievement companies are:
Using data to drive decisions cuts through ego, emotion, hope and excuses.
1. Success Metrics. High Achievement Companies are very clear on what is success. In a world where there is so much feedback and data, High Achievement Companies create clarity by specifically defining what is success for the company or in other words “What is Winning.” High Achievement Companies are excellent at not confusing activity with results. Success Metrics are the 6-ish metrics that cover about 90% of the business and define winning and results from the perspective from key stakeholders such as:
Investors/Owners
Employees
Customers
Industry
Success Metrics are purposely selected and then closely measured and monitored to assess if we are winning or losing as a company. Every member of the leadership team is responsible and accountable to achieve all of these metrics, not just the metrics relating to their functional area. The Leadership Team’s variable compensation is tied to the achievement of the company’s success metrics so they win or lose as a team.
High Achievement Companies are excellent at not confusing activity with results.
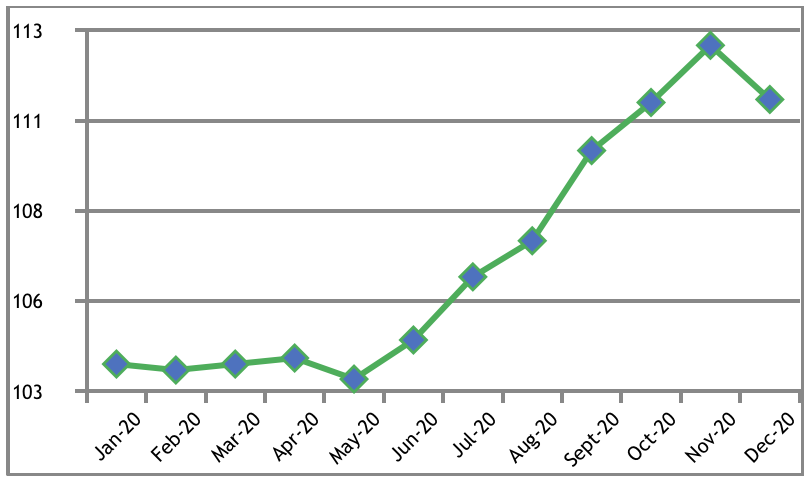
2. Standard Corporate Financials. High Achievement companies use standard corporate financials just like most companies but High Achievement Companies review this data using graphical formats to make the data even more meaningful. High Achievement Companies use several formats such as graphs, bridge charts and 12 month trailing charts for key numbers such as Sales, Gross Profit Margin, EBITDA (dollar and percent), and Operating Expenses Percent. Below is an example of the same data charted as month to month and 12 month trailing. Which one is more meaningful?
Month to Month
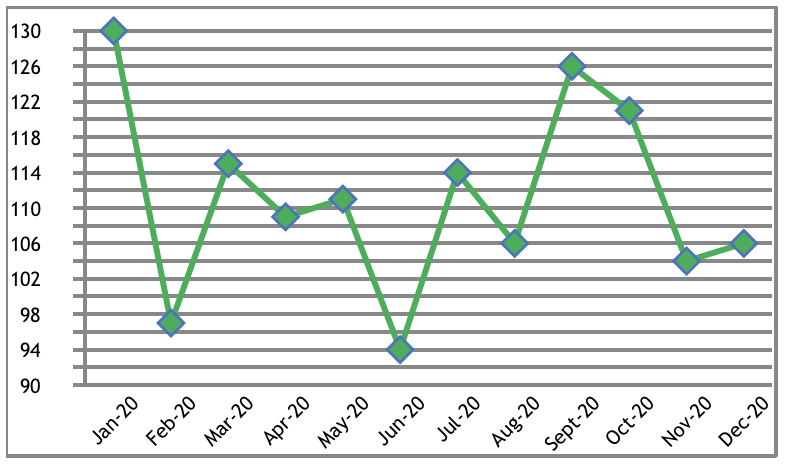
12 Month Trailing Chart
3. Lead Indicators. Lead Indicators are numbers that are predictive for the month, quarter and year. They can be either industry numbers or company specific. High Achievement companies monitor 2 to 3 Lead Indicators on a weekly basis so they can spot trends and respond in a timely manner to either mitigate or exploit the trend.
The best way to not get hooked on Hope-pium is to be disciplined about data and Engineer Your Data for Success. To learn more about Engineering Your Data for Success, email me at Kathie.Mcbroom@thinking-organization.com and I would be glad to share a paper on this topic with you